
We map urban nature

UrbanBioScore — now integrated into Gismap
The work with UrbanBioScore, developed by Aarhus University and distributed through Contech Lab's bynatur.app, now continues as an integral part of the GISMAP platform.
By the end of 2025, bynatur.app will close, and both method and data work will move here — in a new, stronger digital environment.
Gismap combines GIS and UrbanBioScore in one unified tool, where you can record indicators, calculate your UrbanBioScore and share projects directly.
The platform offers a free version that provides access to all the features you need to record biodiversity and calculate an UrbanBioScore for DGNB.
Want access or want to hear more?

Save time and resources mapping your outdoor areas
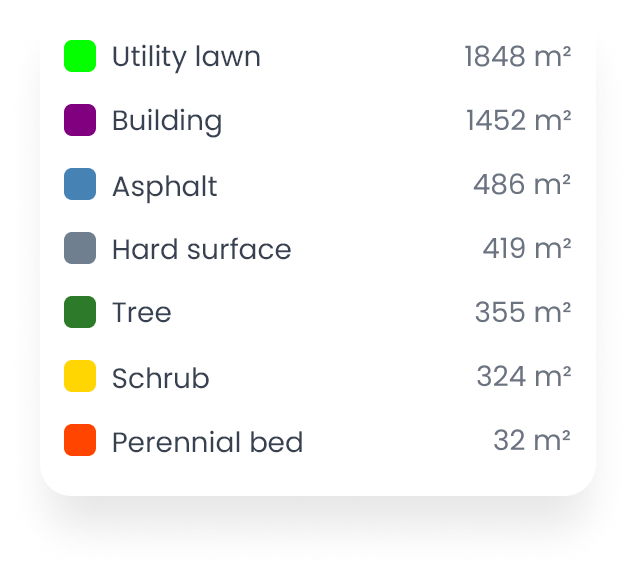
Our AI model generates precise land cover analyses directly on maps, so you can get data for your entire portfolio in no time.
At the same time, we pull data on species observations and protected nature within a 1 km radius of your area of interest, giving you a more complete picture of biodiversity.

Track changes year by year
Go back in time and analyze your portfolio based on historical ortho photos.
Get a clear view of change and identify trends with accurate data.
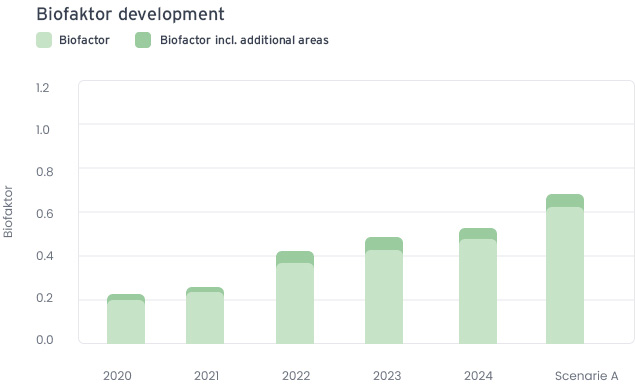
Measure the impact of your actions and document improvements
Our analyses connect directly to Biofactor and UrbanBioScore, so you can easily measure, document and communicate your green initiatives.
The data also supports several of the ESRS E4 measurement points in CSRD, making reporting efficient and data-driven.


Core Functions
Create data
Create Scenarios
Integrate
Who is the tool for?
Municipalities
Gismap can be used to get a digital overview of large areas in connection with local planning, as well as targeting and monitoring of the municipality's biofactor.
Landscapers, biologists, and landscape architects
Gismap can be used in the pre-registration phase to quickly gain an overview of an area, including species observations and protected nature nearby. It provides a data-driven foundation for further planning and operations.
Non-profit housing
In close sparring with non-profit housing managers, we have made it possible to map green areas and follow developments over time. With a data-based overview, you can work purposefully and document your efforts both internally and to external stakeholders.
Pension companies, developers, and other portfolio owners
For larger portfolio owners, it is crucial to have an overview of their land — both to comply with CSRD reporting and to be able to document the development year after year. Gismap offers a scalable and data-driven solution.
Investment funds
In collaboration with an investment fund, we have explored how Gismap can support SFDR reporting. By mapping green spaces across portfolios, mutual funds can bring transparency to their investments.
ESG platforms and third-party providers
ESG platforms can pull Gismap's data directly into their platform via our API, and provide data as an integral part of their solution.
Missing from the list?
We continuously develop the platform in close dialogue with our users. If you have a use-case that we do not know about, please contact us — and we will talk about how we can help.
Contact Us


FAQs
No, Biofactor and biodiversity are not the same thing. Biofactor says something about the volume of green that is in an area, but a high Biofactor does not necessarily mean high biodiversity.
No, Gismap is a platform where you can generate the data (land cover analysis, species observations, and protected nature) that you can use in ESG reporting.
Once a year, the aerial photographs on which the land cover analysis is based are published. When the new aerial photos come out, you will be able to create a new map for that year.
Yes, you can download all your data from the Gismaps platform in common file formats and work with it wherever it suits you best.
The species observations come from Arter.dk and protected nature comes from the Danish Environment Portal (Danmarks Miljøportal).
Yes, you can retrieve all data through an API.
What is Biofactor?
The method has been developed by BUILD (Aalborg University - Department of Construction, Urban and Environment), which itself describes the method as follows: “Biofactor refers to the biological activity that a plot, construction field, residential area or district leaves room for in terms of sheer volume. Popularly speaking, the biofactor can be seen about the average height of the planting if it were to cover the entire plot area.”
Biofactor is an expression of how green a given area is.
Why Choose Gismap?
Optegn nemt dit interesseområde
Vores intuitive værktøj lader dig helt præcist markere det område, som du ønsker vores AI-model skal analysere, hvilket gør processen hurtig og brugervenlig.

Avanceret AI-dreven analyse
Vi har trænet AI-modellen på offentlige data og feltregistreringer. Modellen bruger computer vision og geodata til at analysere dit valgte område og genere omfattende biodata, som du kan anvende i rapportering.

Hent data med API
Uanset hvilket program du foretrækker at arbejde i, har du adgang til dine data gennem en API.

Help us develop the platform to be tailored to your needs
As we develop the platform, your feedback will be invaluable in shaping a product that meets your needs. If you are interested in participating, please fill out the form and we will contact you.
Get early access to cutting-edge AI technology for biodiversity reporting.
Your feedback will directly affect the final product and ensure that it meets your needs.
Receive dedicated support and interact directly with our development team.
Contact Us
Are you thinking of working more data-driven with urban nature and biodiversity?

Want to try our platform?
Please fill out the contact form and we will get back to you as soon as possible.
We have received your inquiry and will get back to you as soon as possible.
Do not hesitate to contact us
If you've become curious about what we can do.

